Data Source & Scope
Our working dataset comes from Kaggle:
 Bigfoot Sightings (BFRO) dataset: https://www.kaggle.com/datasets/mexwell/bigfoot-sightings
Source of Dataset: BFRO (Bigfoot Field Researchers Organization) https://www.bfro.net/
It aggregates decades of reports attributed to the Bigfoot Field Researchers Organization (BFRO) and includes fields such as state, county, year, month, season, narrative observations, classification (A/B/C), and environmental summaries (e.g., weather conditions, moon phase).
What This First Dashboard Shows
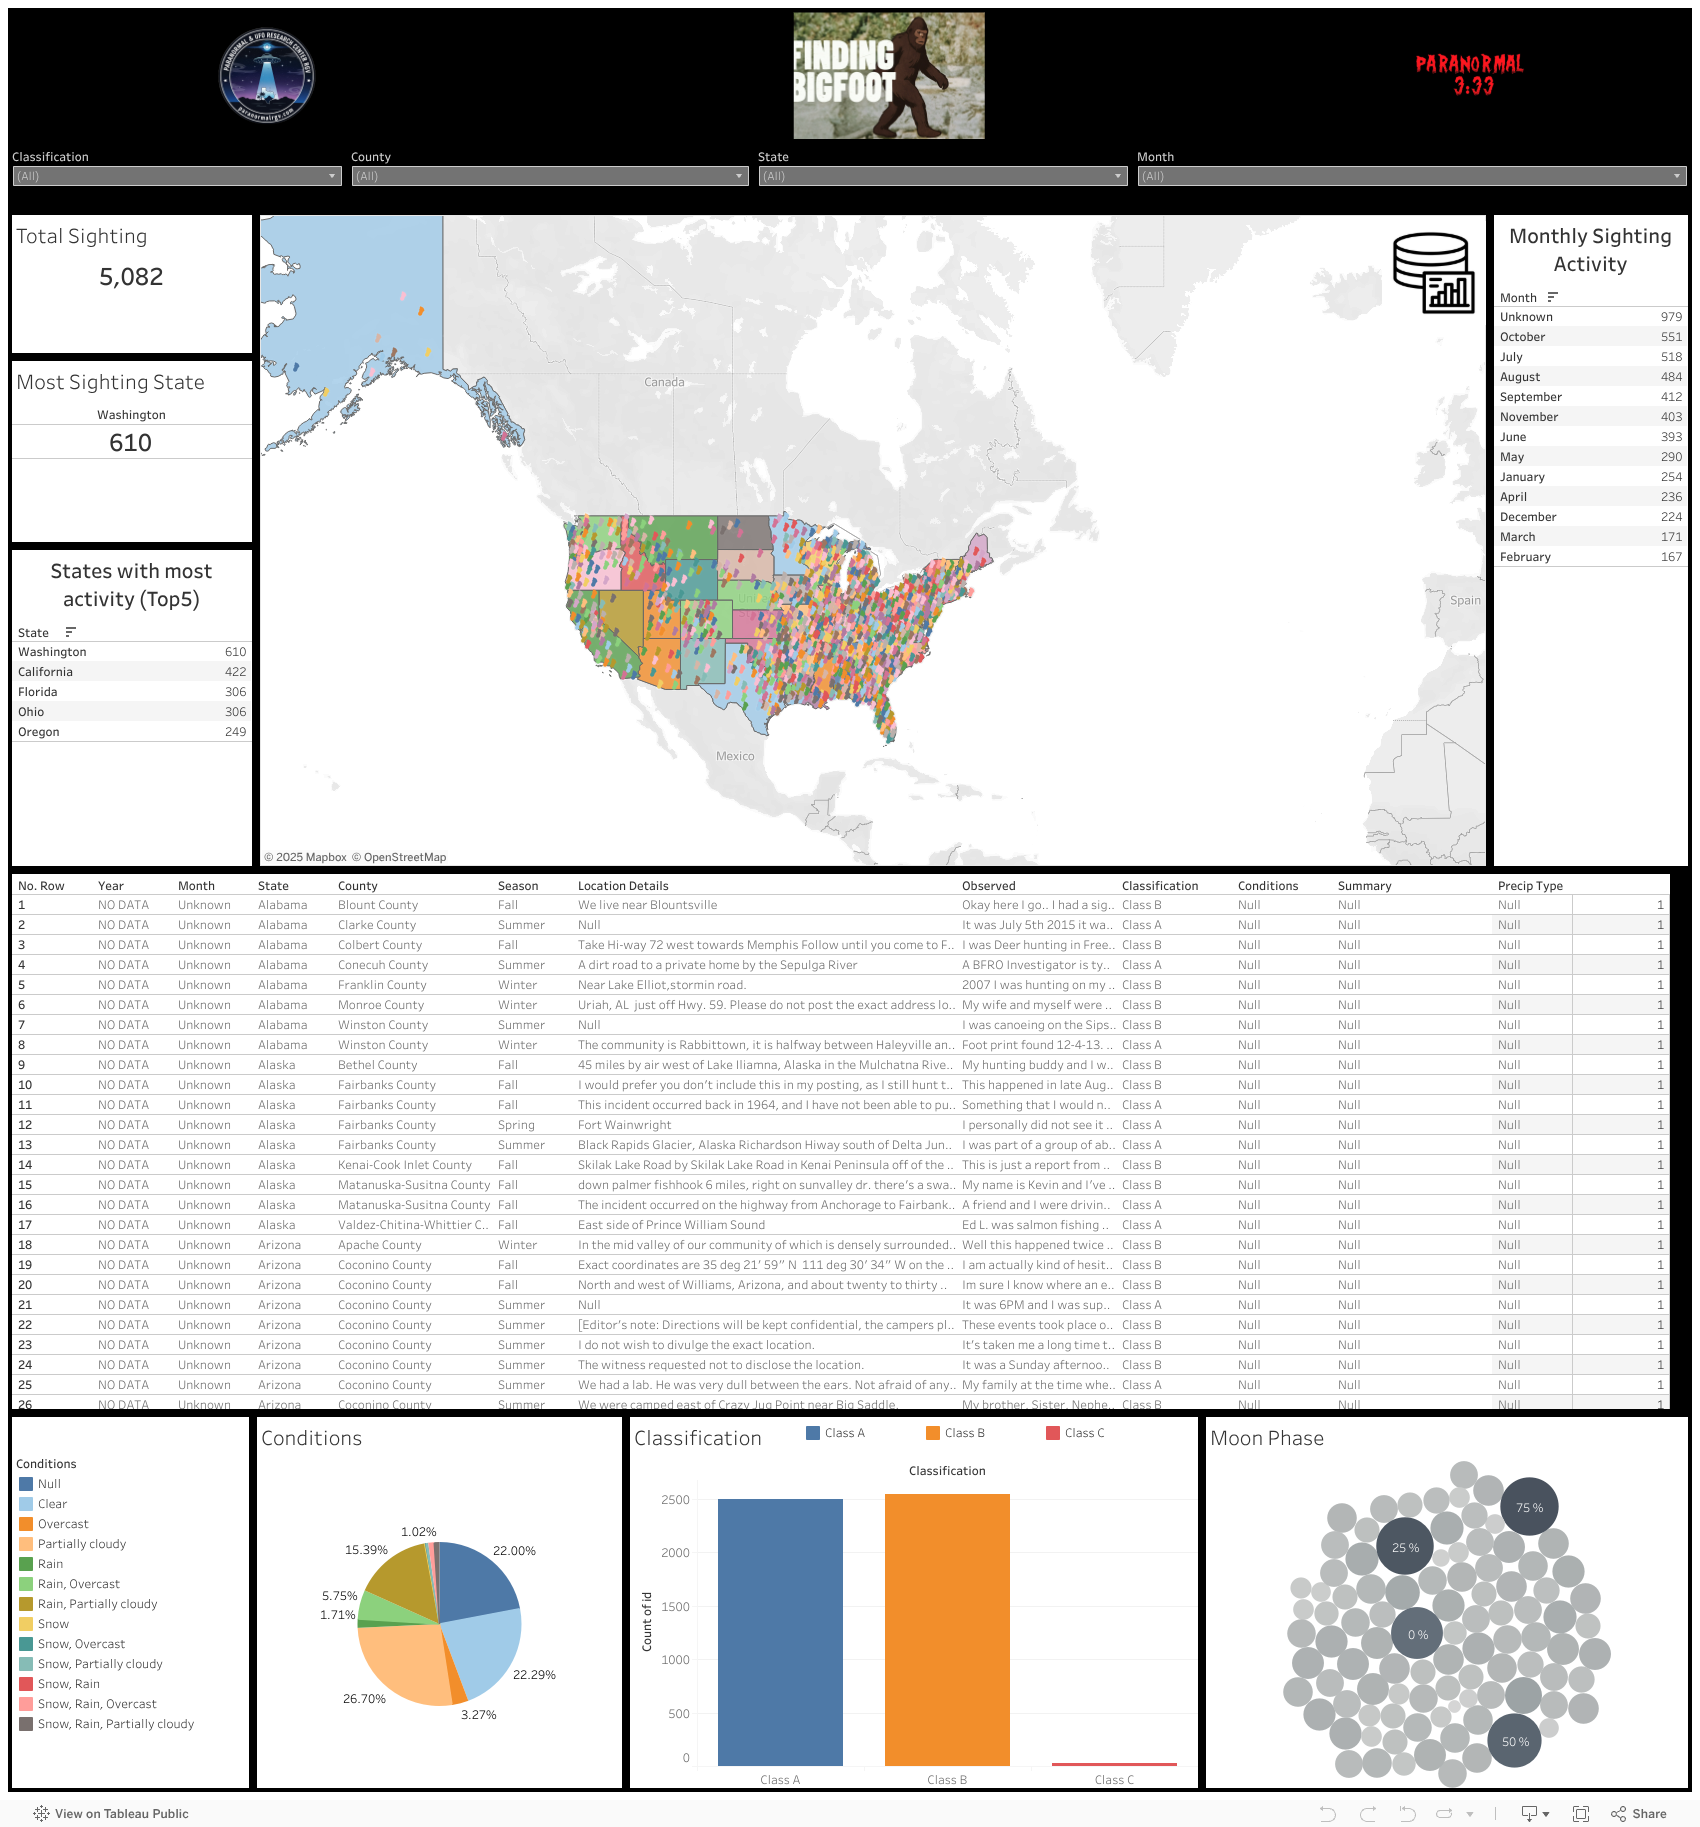
This initial release is designed to be transparent and exploratory. The Tableau view includes:
Total Sightings
Most-Sighting State
Top 5 States with Highest Activity
Interactive Map of Reports
Monthly Sighting Activity
Detail Table (state, county, year, month, season, location details, observed narrative, classification, conditions, weather summary, and precip type)
Conditions Chart
Classifications Chart
Moon Phase Chart
Many records contain NULL or missing values. We intentionally did not add additional derived charts yet; those will come after targeted data completion and validation.
Methodological Notes: Biases We Must Control For
Any serious treatment of cryptozoological data must confront its limitations. Key biases we are tracking:
Self-reporting & selection bias: sightings are voluntarily reported; regions with active communities or media attention may appear “hotter.”
Recall & narrative drift: memory distortion over time can alter details (time of day, distance, weather).
Measurement error & standardization: fields such as “conditions” or “summary” are not consistently defined across years and witnesses.
Geographic & population confounding: higher population and tourism can inflate report counts independent of true phenomenon rates.
Temporal confounding: seasonality, holidays, and hunting seasons may cluster reports independent of the underlying phenomenon.
These caveats do not invalidate the data; they define the guardrails for the types of claims we can responsibly make.
Next Steps: From Visualization to Inference
We are actively preparing a second phase to cross-reference BFRO reports with external, higher-fidelity sources to reduce uncertainty and test hypotheses:
Meteorology: NOAA/NWS historical weather (visibility, precipitation, wind, cloud cover, temperature) aligned at sighting time and coordinates.
Astronomical context: precise moon illumination/phase and civil/nautical night windows.
Geospatial features: land cover, elevation, trail density, protected areas, and remoteness indices (USGS/ESA).
Human activity controls: population density, road proximity, recreational areas, hunting calendars.
Analytically, we will pilot:
Spatio-temporal point-process models to identify clusters beyond what population and access would predict.
Bayesian hierarchical models to borrow strength across states/counties while keeping uncertainty explicit.
Negative controls & placebo tests (e.g., shifting timestamps or locations) to estimate false-positive structure.
Duplicate detection & de-biasing pipelines for narratives and near-duplicate reports.
Our goal is not to “prove” a conclusion a priori but to quantify conditions under which reports occur more (or less) than expected, given environmental and human factors.
Explore the Dashboard
How You Can Collaborate
We are inviting contributors to help transform this into an open, testable research program:
Data engineering: cleaning NULLs, harmonizing categorical fields, geocoding QA.
Feature engineering: deriving weather, illumination, terrain, and access covariates at report time/loc.
Modeling & inference: spatio-temporal modeling, causal controls, uncertainty quantification.
Visualization & UX: better filtering, comparators (e.g., “expected vs observed” by county/season).
Field methods: guidelines for standardized future reporting to reduce bias at the source.
We credit all accepted contributions and plan to publish methods and code artifacts with detailed documentation.
 Contact: info@paranormalrgv.com